ustxtxb_obs_1975_01_31_50_00004-00000_000.pdf
Page 14
140PRISONER POPULATION 135PER 100,000 POPULATION I I 130125120115110105100959085TEXAS PRISONER POPULATION IN I It” I. NATIONAL PRISONER POPULATION I 1950 1955 1960 1965 1970 641 ncarcerations per Texas -8.0 62_ 100,000 Population Unemployed Rate all 60 Texas Incarcerations 58 I %-7.0 56-6.0 5452 I -5.0 5048 -4.0 46-44 44Texas -3.0 42-Unemployment 40 s f -2.0 38 1950 1955 1960 1965 1970 Figure 2. National and Texas Prisoner Population Compared 1950-1971 Source: Texas Department of Corrections. U.S. Department of Justice. Both of the upward trends, however, were broken temporarily during the middle 1960’s. The explanation for the breaks in the trends of sending men to prison and total prisoner populations during this period reveals another prime fact about incarceration practices in Texas. Accounting for the trends of incarceration in Texas entails looking outside the walls. The answers are to be found in the social and economic conditions of Texas society. The relationship between economic conditions and the rate of imprisoning men in Texas for the years 1950 through 1972 is presented in Figure 3. The unemployment the annual average rate of jobless workers reported by the Texas Employment Commission and the incarceration trend represented in Figure 1 the new prisoners received in TDC from the courts. Incarceration rates rise in economic recession years. The unemployment rate for the recession year of 1961 was 6 percent and the incarceration rate for that year was 57 new prisoners received per 100,000 Texas civilian population. The highest incarceration rate in Texas history of veterans returning from Vietnam and the post-war economic recession of 1971. Incarceration rates decrease during periods of economic prosperity. This aspect of the relationship between economic conditions and incarceration is especially noticeable during the economic mobilization of war years when the military services drastically reduce the civilian labor supply. During the Korean Texas dropped to 3.2 percent and the rate of committing men to prison reached a historic low of 37.6 men per 100,000 estimated civilian population. During the peak of the Vietnam war 4 The Texas Observer Texas history at 2.7 percent of the labor force and the incarceration rate dropped to a low of 44.8 men -per 100,000. Closer inspection of the trends depicted in Figure 3 reveals the changing pattern of in carceration practices in Texas. Comparing the period of the early 1950’s to that of the late 1960’s and early 1970’s shows that the relationship between economic conditions and imprisonment in Texas is becoming even stronger. For example, 1954 and 1971 were both demobilization years with comparable levels of unemployment \(4.4 and 4.2 percent higher rate of incarcerating men \(45.3 per 100,000 in 1954 compared to No discussion of the Texas prison system can be meaningful without consideration of the issue of race and imprisonment. Figure 4 presents the important facts on this fundamental issue. Figure 4 compares the black proportion of the Texas prisoner population to the proportion of blacks in the population at large. These figures show that although black Texans have always been over-represented in the Texas prison system, the most dramatic increase has taken place recently \(in the late 1960’s and and 1969 represents a 32 percent increase. It should be noted that this increase is concurrent with the recent flooding of the Texas prisons. The disproportionate composition of the Texas inmate population reflects the basic relationship between economic conditions and imprisonment. Black Texans are the target of higher incarceration rates because of the severe economic disadvantages that they suffer. Although historical Texas labor statistics are not reported by race, available evidence indicates that Texas follows the national pattern with blacks having twice as high an unemployment rate as whites. A 1966 study by the Department of Labor \(“Joblessness and Poverty in Urban Slums,” Manpower Report of the President, economics of slum life in ten major American cities. This study found an unemployment rate of 8.1 percent in the slums of San Antonio compared to 3.9 percent for the metropolitian area as a whole. The Department of Labor estimated the sub-employment index for San Antonio slums to be 47 percent. This sub-employment index includes, in addition to jobless workers, part-time workers who wanted full-time jobs and employed workers whose earnings were less than minimum wages. The average sub-employment rate found for the ten cities surveyed was 34 percent. This study also found that 88 percent of all urban slum dwellers were non-white. More recent statistics indicate that conditions have degenerated even more. Figure 3. Texas Unemployment and Incarceration Trends Compared 1950-1972. Source: Texas Department of Corrections. Texas Employment Commission. Significantly, the urban slums of Texas are the source of the majority of offenders committed to TDC. Fifty-six percent of the inmates received in TDC in 1972 came from the Dallas, Fort Worth, Houston, and San Antonio metropolitian areas. This trend is also increasing in 1949 these same areas contributed only 35 percent of the inmates. In short, the rising trend of incarceration has been concurrent with the increasing urbanization of Texas. THE FACTS revealed by the hidden history of the TDC answer the big questions about incarceration practices in Texas. Why Texas incarcerates such a massive number of offenders is now clear the TDC has become increasingly sensitive to the economic conditions in the state. It has become a dumping ground for marginal Texas citizens in times of economic dislocations. As long as this relationship is allowed to exist, the most carefully conceived and executed reform programs will have little chance of success. Incarceration practices will continue to be dictated by economic conditions rather than rational penal philosophy. The question of race and imprisonment can also be answered in light of the facts of the hidden history black prisoners now account for 44 percent of the total prisoner population because imprisonment has become an institutionalized way of handling the crime problem that has been generated by the urban ghettos of Texas. Seventy-five percent of the black population of Texas now live in major metropolitian areas and the in-migration is continuing. Without major changes in the criminal justice system of Texas \(and the continuing upward trend of imprisoning black Texas citizens. The prospect for prison reform must be considered in the light of the answers of these big questions. It must also be kept in
You May Also Like
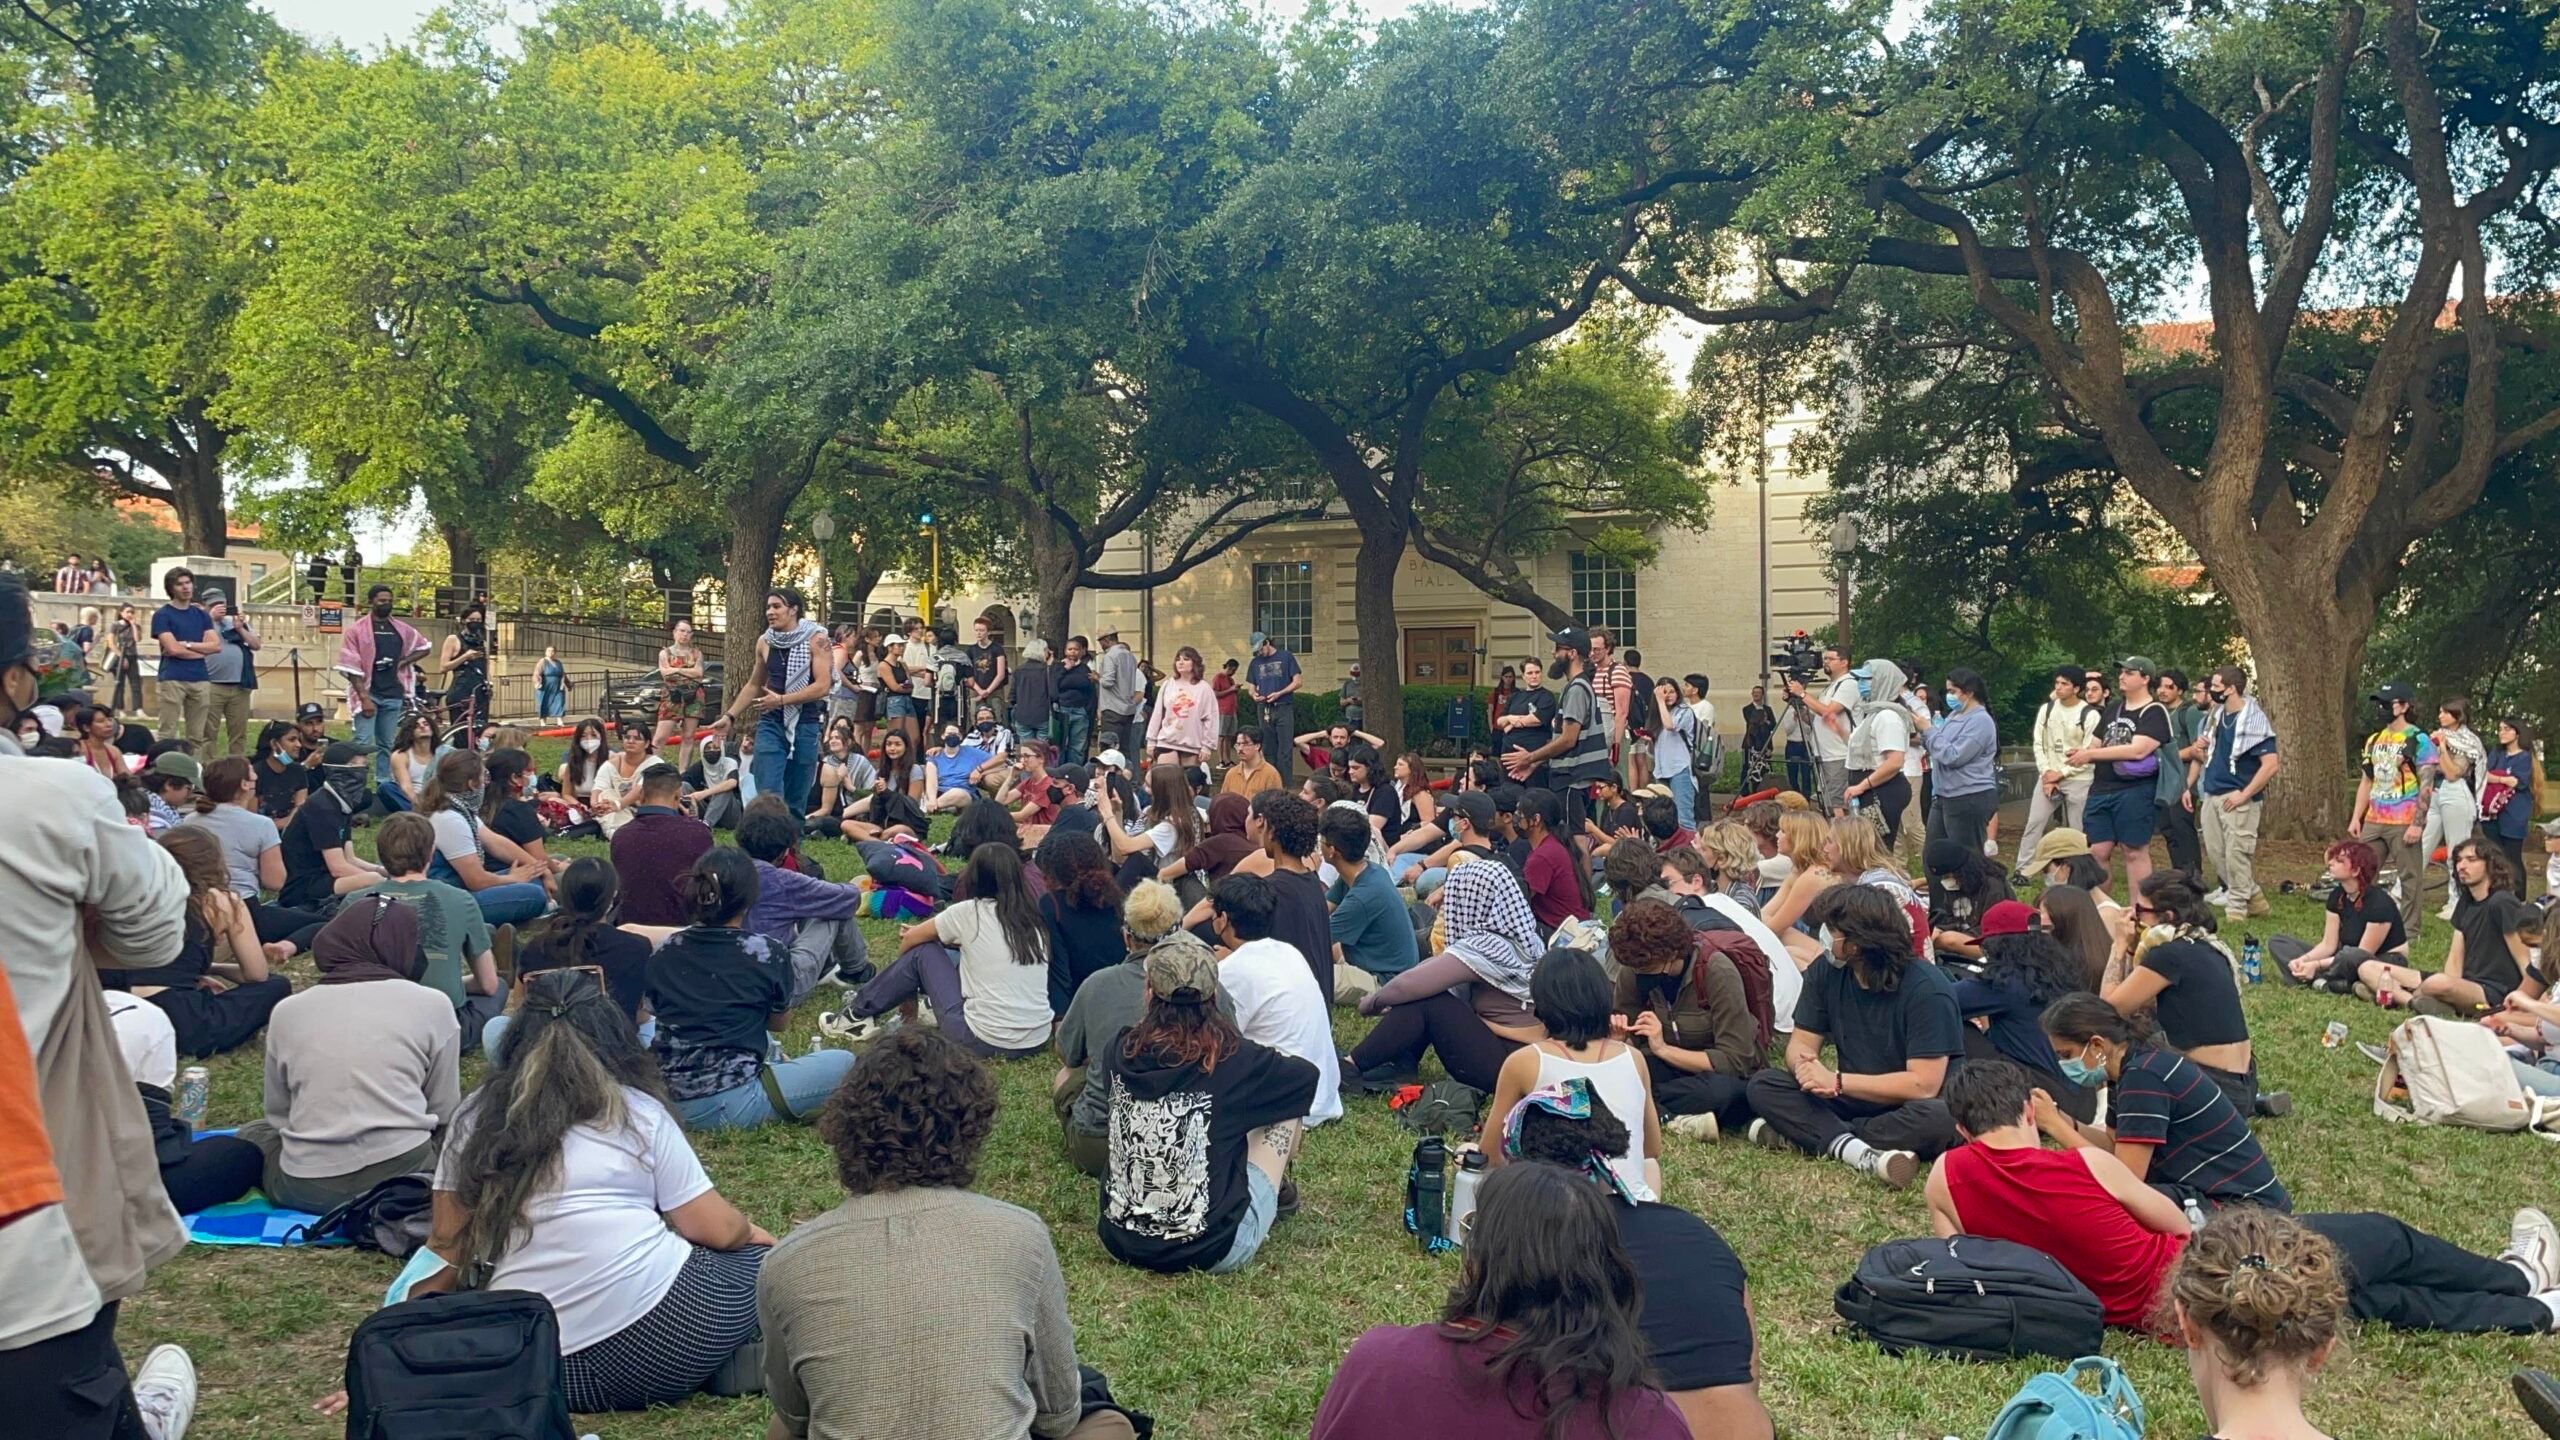
Did Texas Police Violate First Amendment Rights of Pro-Palestine Protesters?
A UT professor and expert on freedom of expression weighs in on the controversial arrests of 57 individuals, including a journalist, at a campus demonstration.

Texas Exotic Hunts Are Dangerously Unregulated
Some hunting ranches in Texas routinely offer hunts of endangered or threatened exotic species. This should not be allowed.
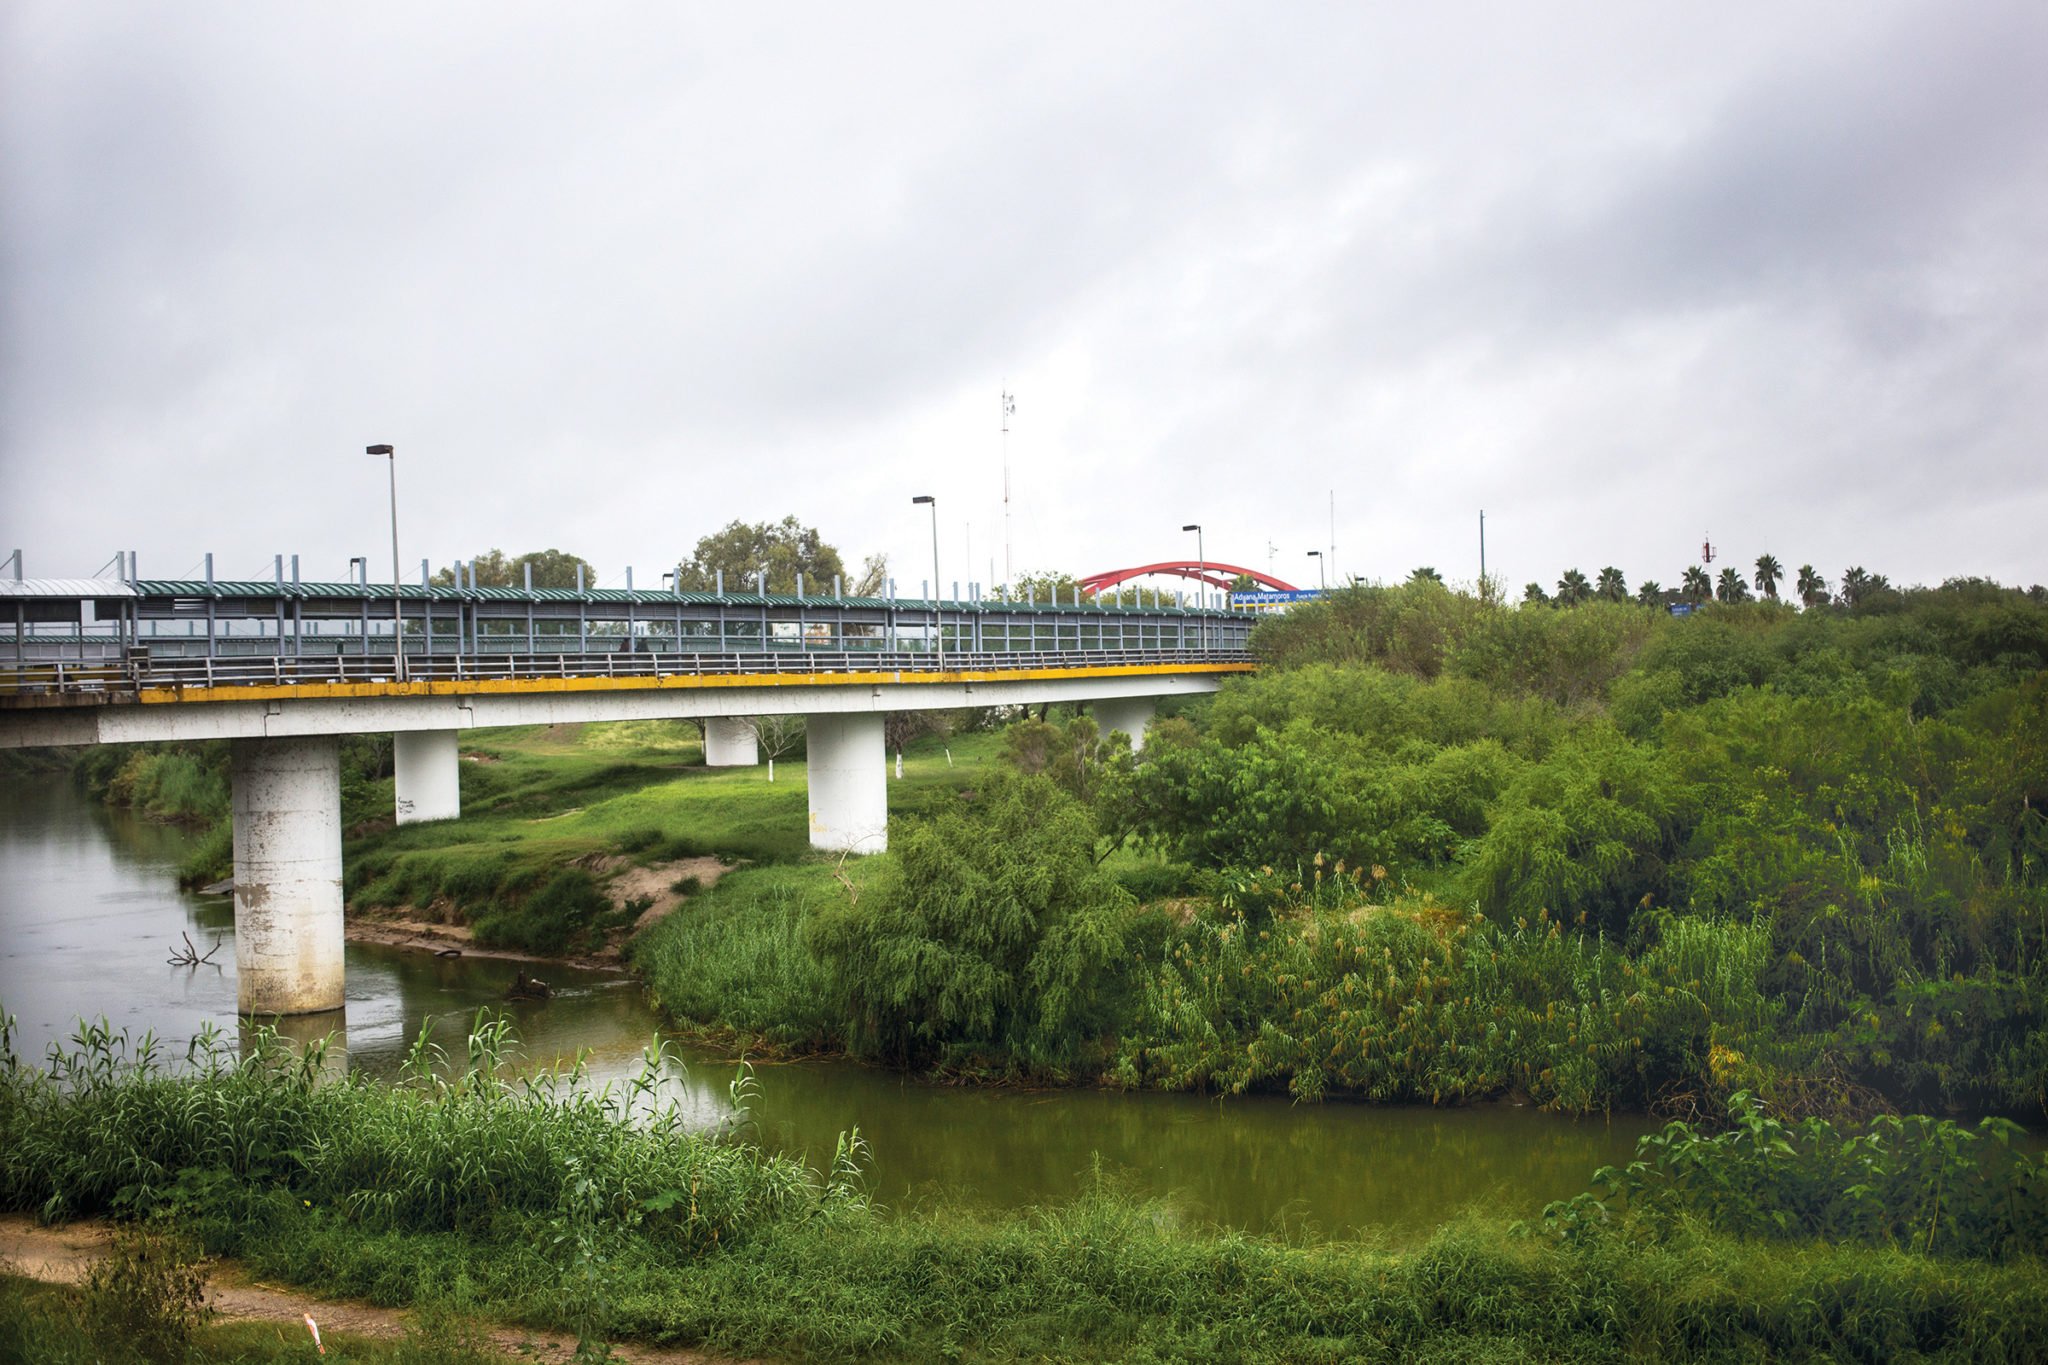
An Unwinnable Drug War
Threats to deploy U.S. troops to Mexico ignore an appalling reality that has already been a disaster for both nations.