What Climate Change Means for Texas in 11 Charts

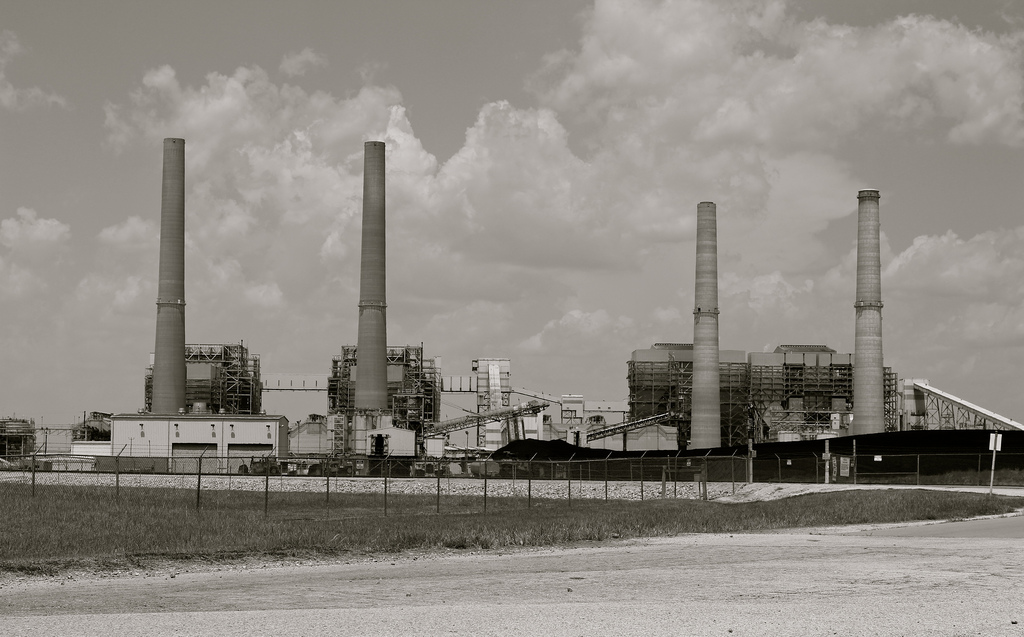
Above: W.A. Parish coal plant
The new federal climate assessment, which came out Tuesday, tells us what we (should) already know. But does it in great and alarming detail, linking what’s already occurred to what else is in store. In short: Climate change is here. We’re already feeling the effects. And things will get much worse without a concerted effort to reduce emissions globally.
For Texas, which is lumped in with the Great Plains region, the National Climate Assessment finds that the state is getting hotter, exacerbating droughts. Precipitation patterns are changing, with more infrequent but heavier downpours. And sea-level rise is putting low-lying coastal communities like Galveston and Houston at increased risk of storms and loss of habitat.
The report, of course, was greeted by Texas politicians and regulators with the usual fact-free distortions and obfuscation we’ve come to expect. (More on that later.)
It’s a compelling report and the website presenting the findings is well worth your time. Here are a few visuals that tell the story.
First, a little scene-setting… The increase in the concentration of greenhouse gases, especially carbon dioxide, is driving the increase in global temperature averages.
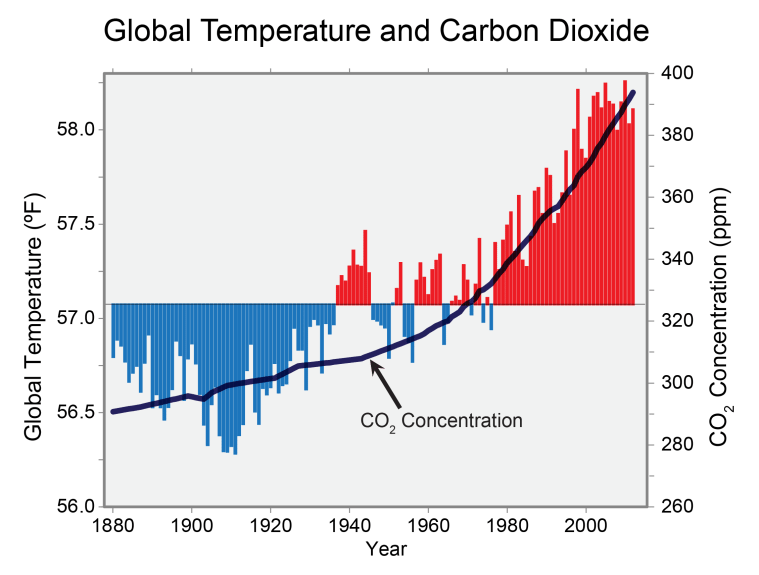
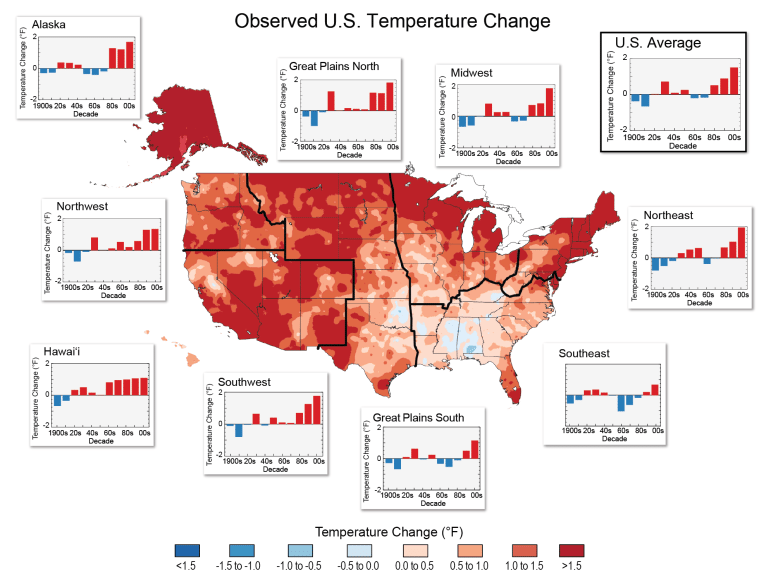
Average temperatures have risen across the U.S. since the late 19th century, with most of the increase occurring since 1970. The hottest year on record for the contiguous United States, including Texas, was 2012.
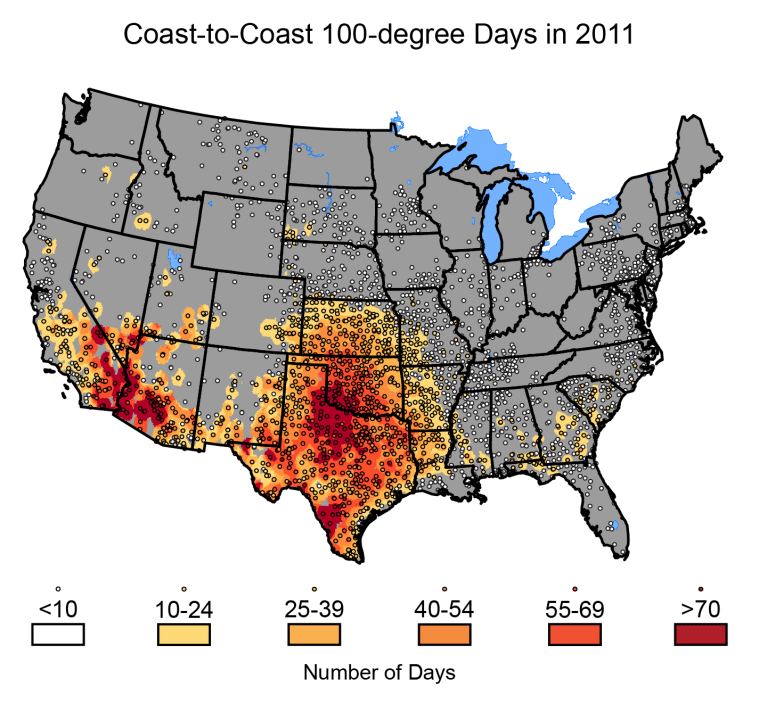
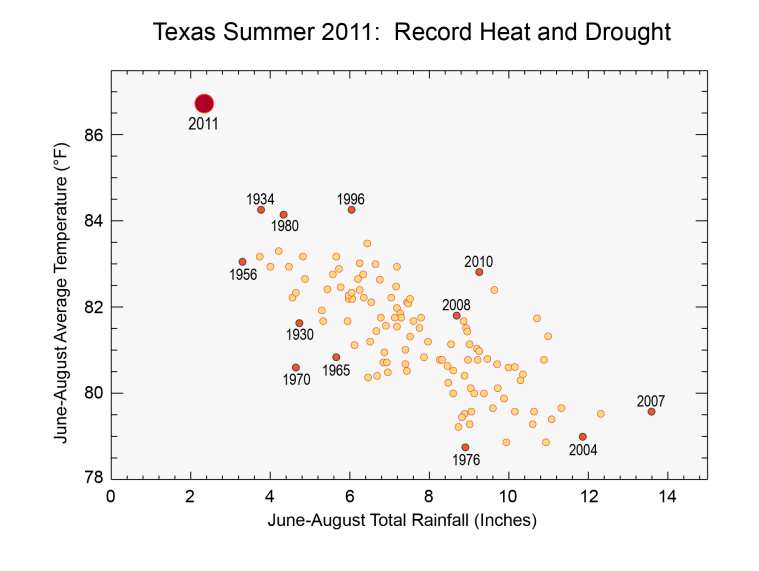
The assessment uses the record hot and dry summer of 2011 in Texas and Oklahoma as an example of how “extreme climate events resulted in cascading effects across energy, water, and land systems.” In Texas, the summer of 2011 was 5.2 F hotter than normal, with more than 90 days of 100-plus days in parts of the state.
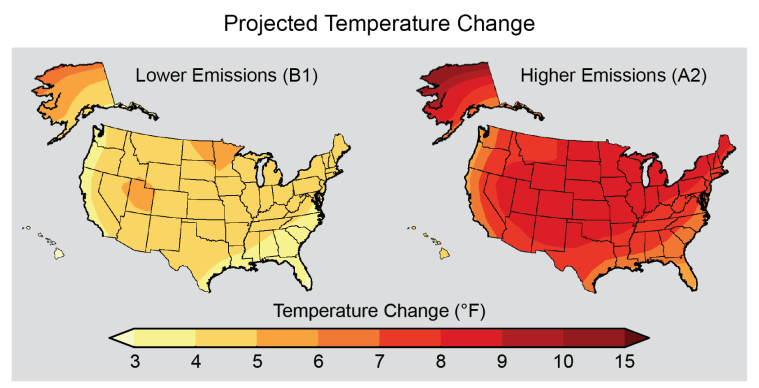
We can expect more brutally hot days—a quadrupling of days in the southern part of the Great Plains by mid-century—and higher temperatures across the board in the future, especially under higher-emissions scenarios. (Throughout the report, the authors relied on two different projections: The “lower emissions” scenario assumed a “substantial reduction” in greenhouse gas emissions and a temperature increase by the end of the century of 3 to 5 F; the higher emissions scenario assumed continued increases in emissions, leading to a 5 to 10 F increase by 2100.)
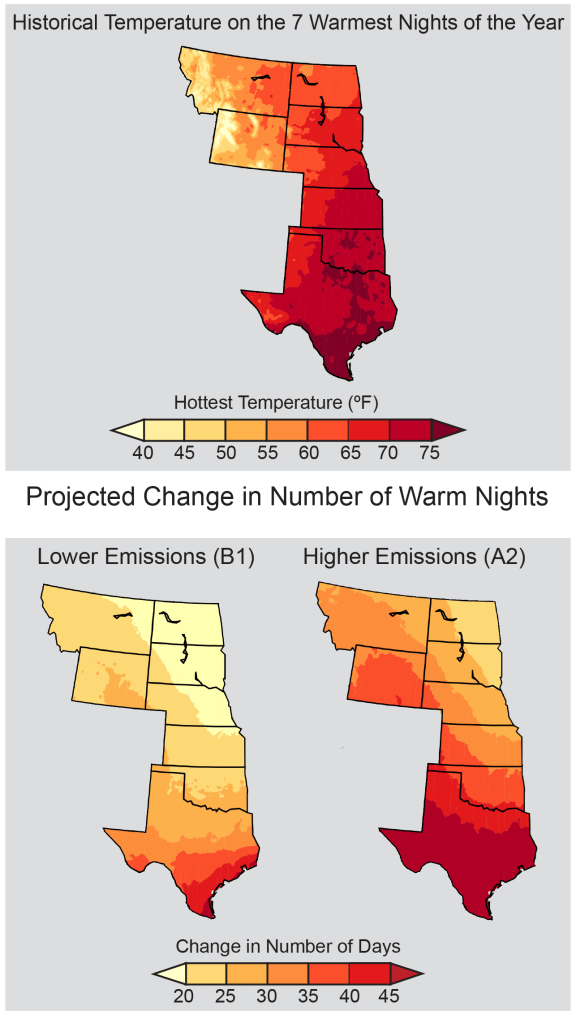
The number of warm nights will also rise, increasing water losses in lakes and streams, heat stress and demand for air conditioning.
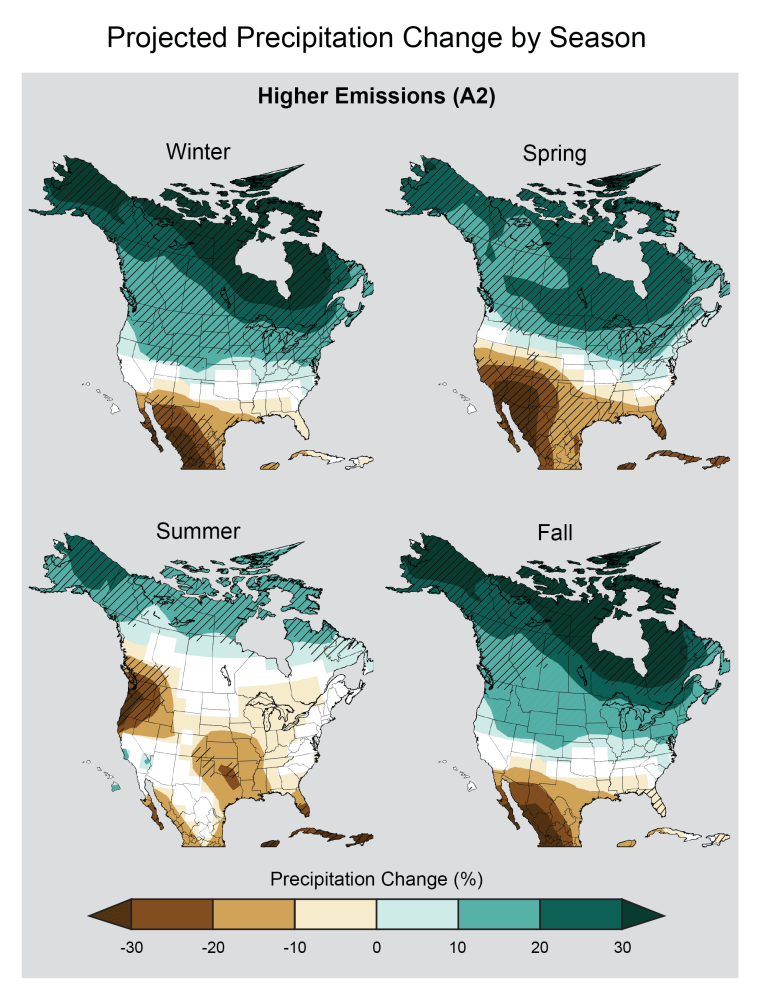
Rainfall patterns are changing too.
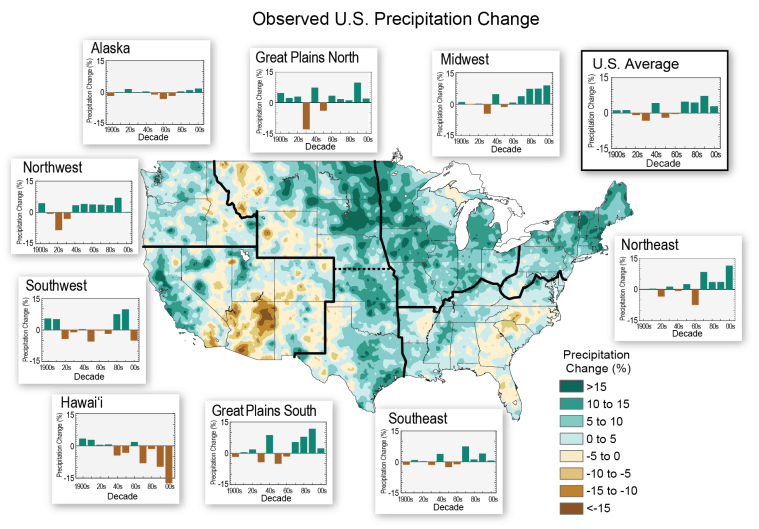
Texas has always been drought-plagued, but increasing heat and projected changes in rainfall patterns likely means longer dry spells.
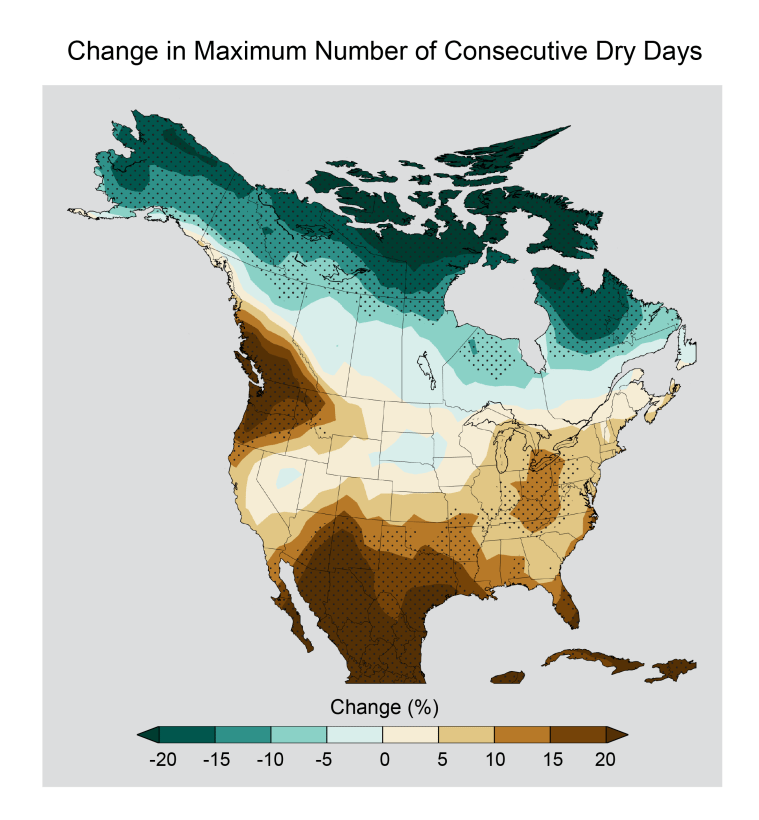
We can also expect seasonal changes in precipitation. Spring, in particular, may be significantly drier across Texas.
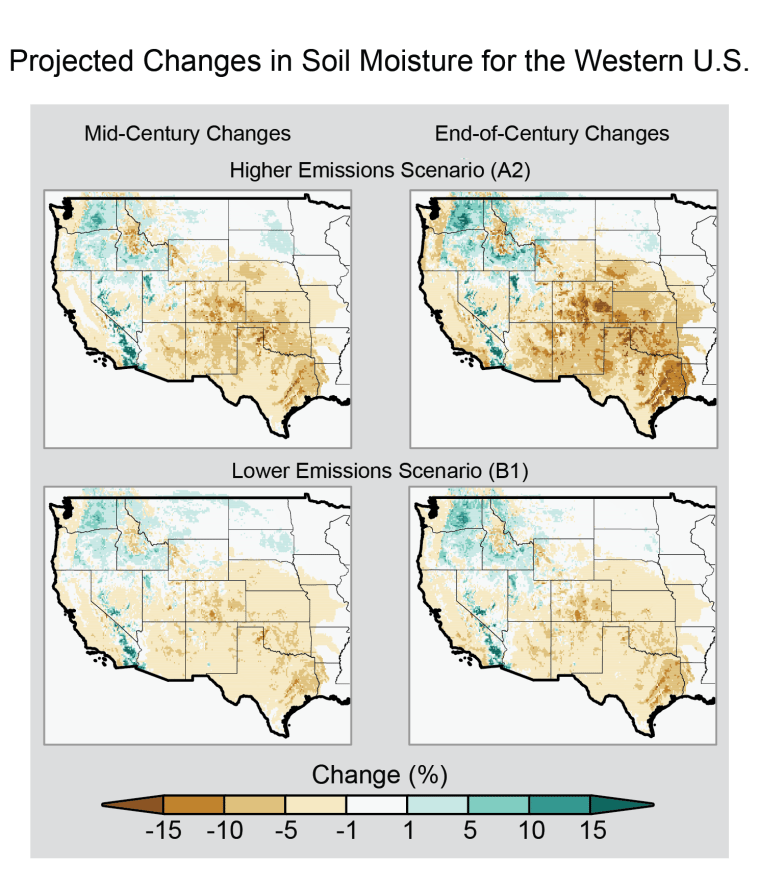
Soil moistures are decreasing, a major hurdle for farmers trying to coax crops from the soil. Parched land will be a growing problem, in particular, in areas like the Panhandle, where farmers are transitioning from the depleting Ogallala Aquifer to dry-land crops.
“Climate disruptions to agricultural production have increased in the past 40 years and are projected to increase over the next 25 years,” the assessment states.
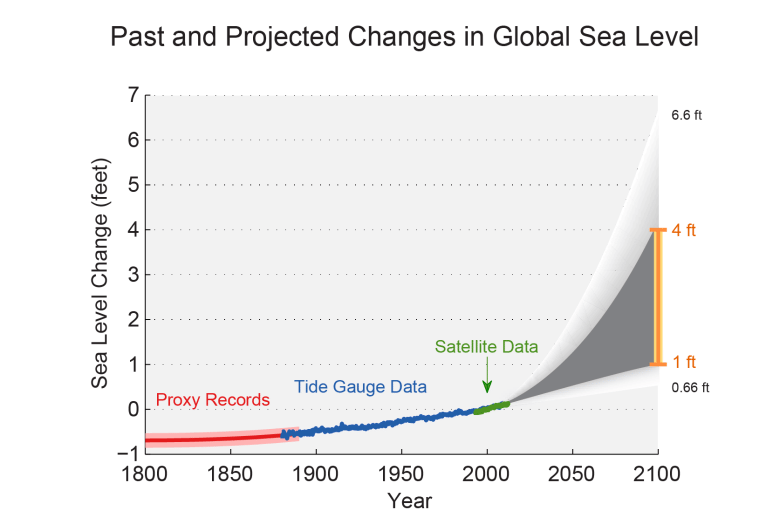
Finally, sea levels have been rising inexorably, with an acceleration since the 1970s. Because of all the heat that’s already in the system, oceans will continue to rise for millennia. But by how much and how quickly is dependent on how much more carbon is pumped into the atmosphere. The assessment projects that oceans are likely to rise 1-4 feet by the end of the century, but the report does not rule out an increase of six feet. Much of the Texas coast—including barrier islands like Padre and Galveston, that protect the mainland from tropical storms—is only a few feet above sea level. And sea-level rise will not be uniform. In some areas, like around Galveston-Houston, the ground is sinking as well.
**
And what is the response from Texas’ top officials to this sobering report?
Gov. Rick Perry: He’s refused to say anything. “Gov. Rick Perry’s office did not respond to a request on Tuesday to describe his policy for preparing the state for climate change and reducing its impact.”
Notably, Perry once wrote that the planet is actually cooling.
U.S. Sen. John Cornyn: He didn’t address the report directly, but also avoided putting himself squarely in the denial camp.
“I am not one that denies that human beings have an impact on the environment. But I am sure not willing to put the federal government in charge of trying to micromanage the environment for the United States of America, nor for us to drive up the price of energy for people on fixed income, like seniors and people of modest means, by putting restrictions in place that other nations are not.”
U.S. Rep. Lamar Smith: He’s the chair of the House Science Committee, so what do you think his take was?
“This is a political document intended to frighten Americans into believing that any abnormal weather we experience is the direct result of human CO2 emissions.”
And, finally, the Texas Commission on Environmental Quality:
The environmental agency seems mightily concerned about the coal industry.
“There has been no significant global warming in more than 15 years, although carbon dioxide levels continue to rise. It is clear that the science of global warming is far from settled. Regulatory policy cannot be set without firm guidelines and the proven cause and effect that would dictate policy. The NCA global warming policy will result in greatly reduced use of coal for energy generation. This will impact the reliability of the electrical grid, and will also increase energy costs. It will particularly impact energy prices for those who can least afford it, such as the elderly and the poor. This is the true environmental impact of the war on coal.”
Just for the record, here are the top 10 warmest years on record globally, according to NOAA (not in rank order):
2013 (tie)
2012 (tie)
2010
2009 (tie)
2007 (tie)
2006
2005
2004 (tie)
2003 (tie)
2002
1998
You May Also Like
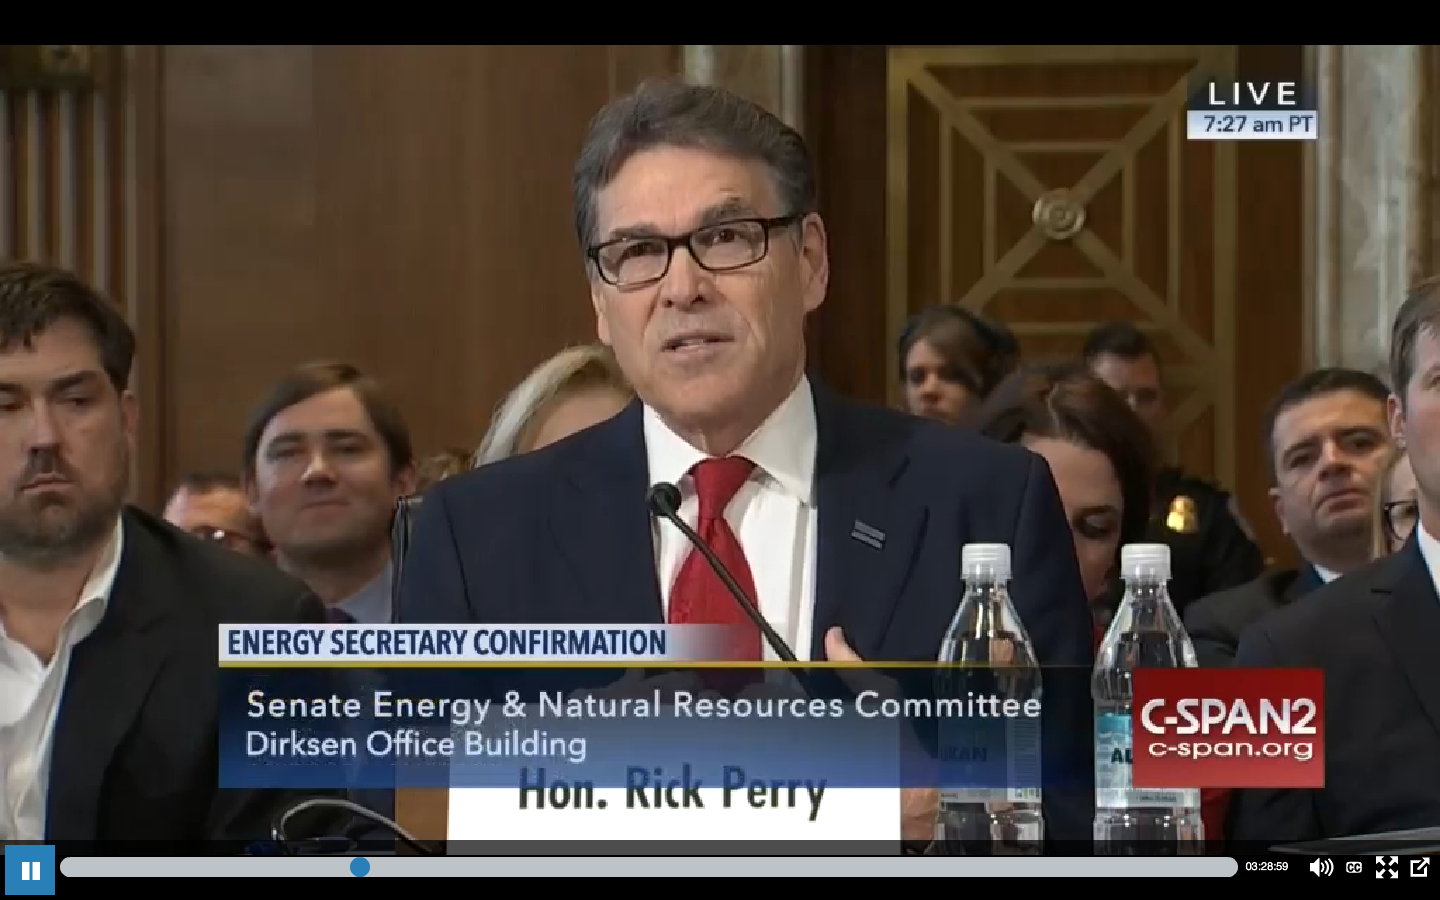
Rick Perry Partially Reverses Stance on Climate Change, Agrees ‘Some of It’ is Man-Made
After more than a decade of questioning climate science, Perry softened his stance at his confirmation hearing on Thursday.